Nitrogen dioxide (NO₂) Port of Rotterdam Pollution Monitoring Living Laboratory
Ultrafine Particles (UFPs)
This page is your gateway to understanding and engaging with our ongoing effort to monitor air pollution in the Port of Rotterdam—specifically focusing on nitrogen dioxide (NO₂). Here, you’ll find a comprehensive overview of our project’s current status, and how you can get involved.
Explore photos and videos from our field activities, learn what nitrogen dioxide (NO₂) are and how they a!ect health and the environment, and dive into our training materials and measurement results. We also provide access to raw data collected during our monitoring campaigns so that anyone can explore or analyze our findings.
Interested in joining the movement? Use our registration form to become part of our citizen science team. For additional clarity, check out our FAQ section to get answers to common questions.
Whether you’re a concerned resident, researcher, policymaker, or port professional, this page is designed to help you understand the problem, see the data, and be part of the solution.
Table of Contents
Nitrogen Dioxide (NO₂) Pollution Monitoring Research Programme
Overview
This project is a community-led air pollution monitoring initiative that targets nitrogen dioxide (NO2) in the greater Port of Rotterdam area. Our aim is to empower residents to collect scientifically robust data that not only complements but goes beyond offcial monitoring networks by incorporating sensitive locations such as hospitals, schools, and retirement homes.
The project integrates real-time vessel proximity data using AIS data to enhance the interpretation of port-related pollution. This initiative will contribute to transforming the Port of Rotterdam into a living lab for participatory environmental science and innovation.
Project Goals and Objectives
1. Recruit and train 15 citizen scientists to conduct biweekly NO2 sampling across 12 strategically chosen sites.
2. Capture pollution data in locations underserved by traditional networks, particularly near health-sensitive facilities.
3. Cross-validate citizen-collected data with existing government-run nitrogen dioxide (NO₂) monitoring stations (LML / RIVM).
4. Track and associate pollution spikes with nearby vessel traffic using geofencing and AIS data.
5. Inform local health and environmental policies through publishing our open source data and visualizations.
6. Communicate monitoring results to the public through compelling visualizations and community workshops.
7. Establish the Port of Rotterdam as a living lab that supports experimentation and collaboration among communities, academic partners, and public authorities.
Study Area and Monitoring Sites
The project includes 12 core monitoring locations across the Port of Rotterdam area, strategically selected to cover both sides of the Nieuwe Maas river and include a mix of official monitoring stations and sensitive locations like schools, hospitals, and retirement homes.
8. Rotterdam-Cruise Terminal 9. Pernis Elementary School 10. Rotterdam-Hoogvliet (LML station) 11. Rozenburg Retirement Home 12. Maasvlakte (LML station)
Site Selection Strategy
Source-Oriented Sites
These are locations chosen for their close proximity to known pollution sources, such as shipping lanes, container terminals, fuel storage facilities, and industrial plants within the port. Monitoring here aims to quantify ultrafine particle (UFP) emissions at or near their point of origin, providing data on peak concentrations and supporting accountability and policy interventions targeting emission sources.
Health-Driven Sites
These are locations selected based on where people live, work, learn, and spend leisure time, particularly in neighborhoods with vulnerable populations such as children, the elderly, or those with respiratory conditions. The goal is to assess real-world human exposure to UFP pollution and highlight potential public health impacts, especially in communities that may already bear disproportionate environmental burdens.
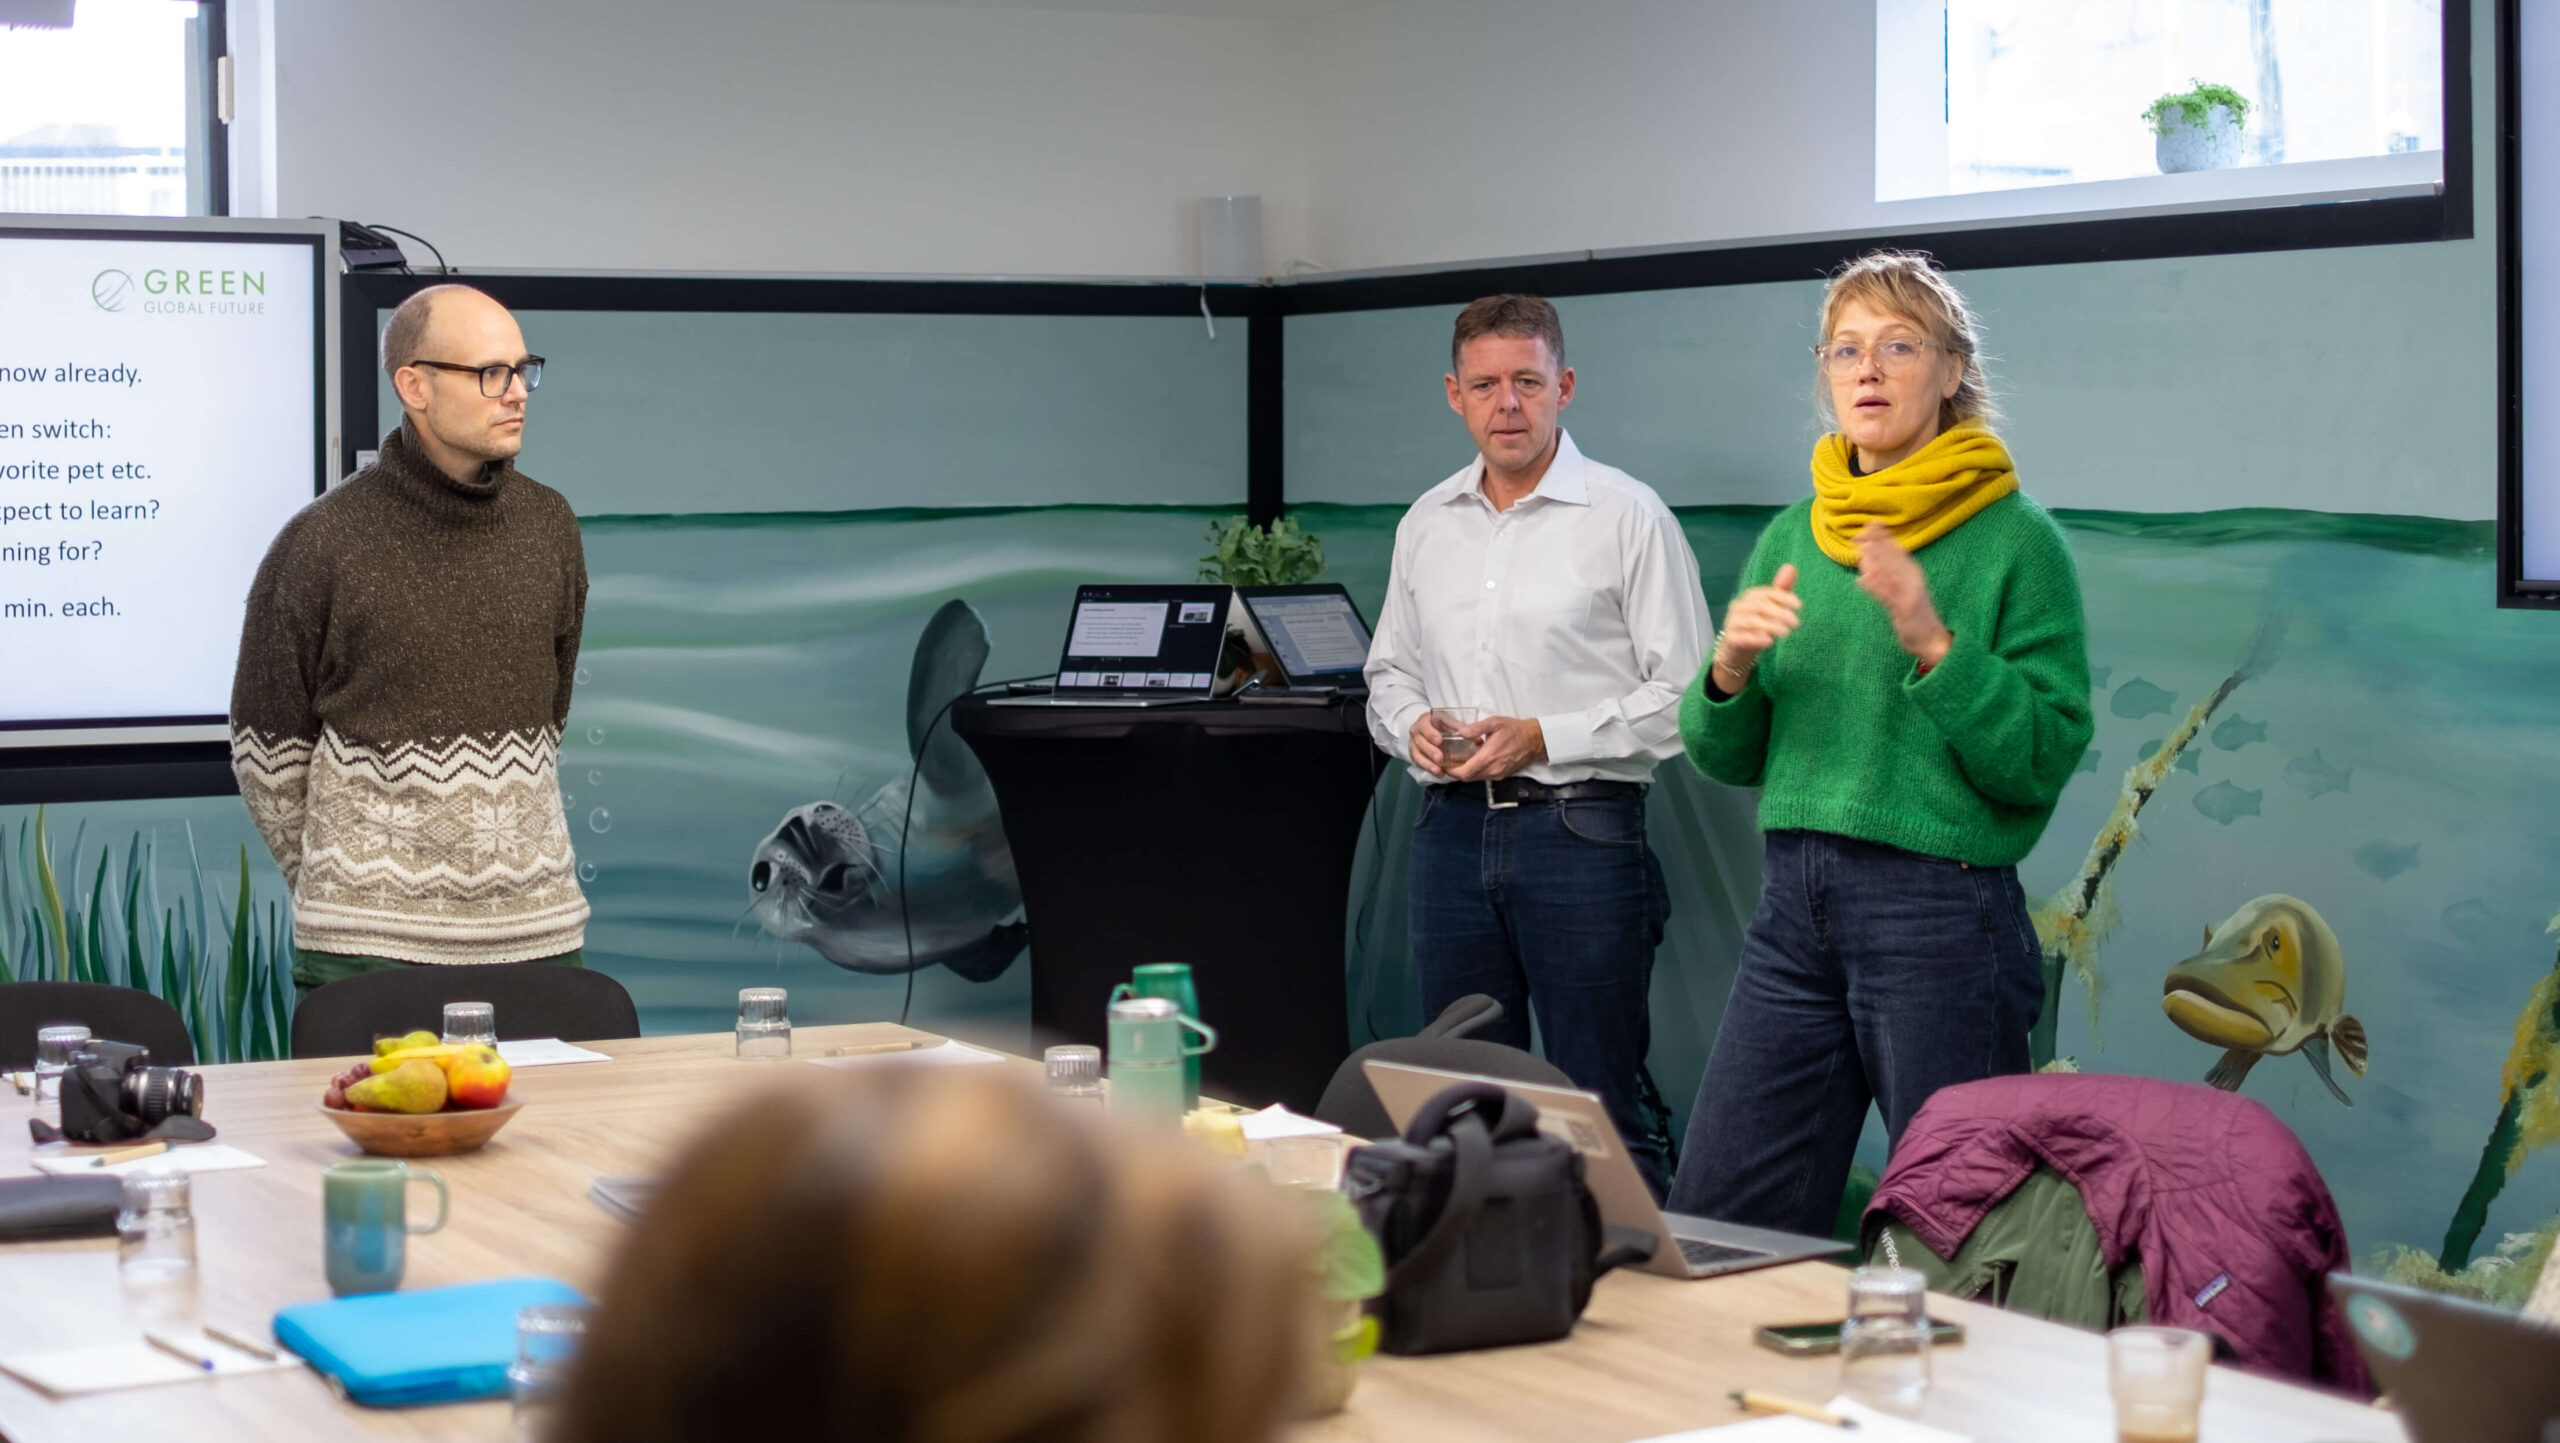
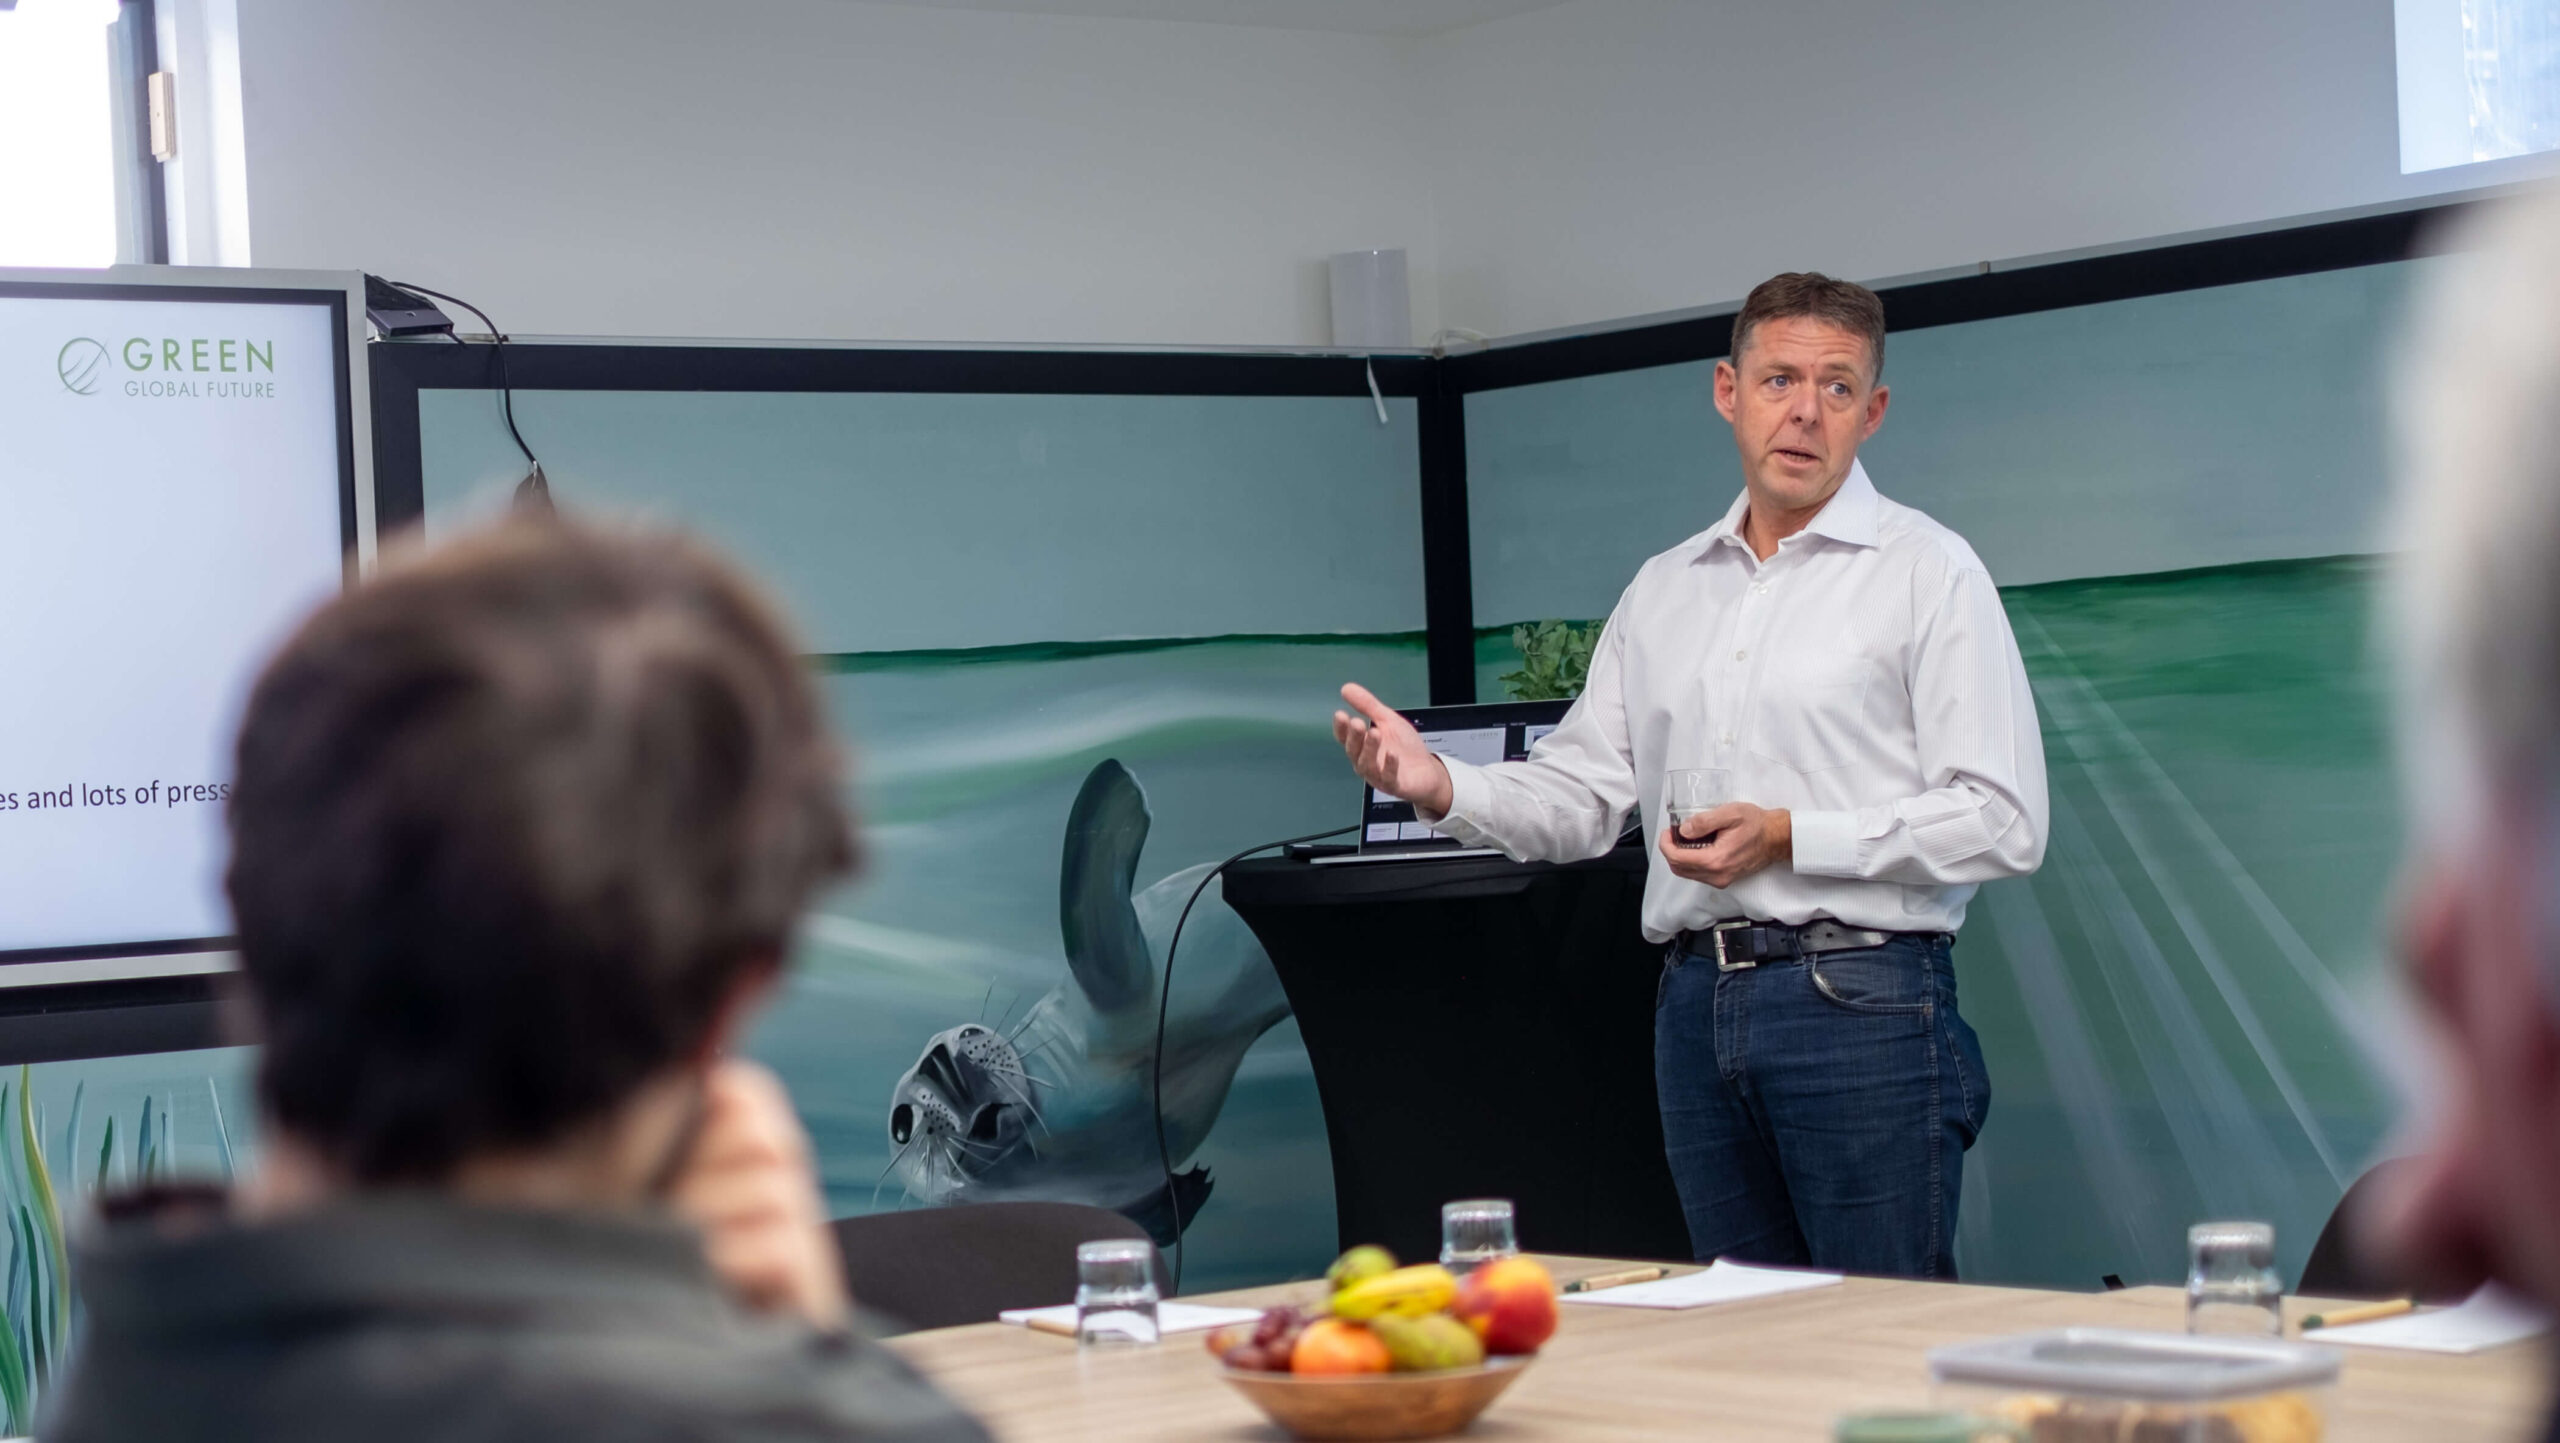
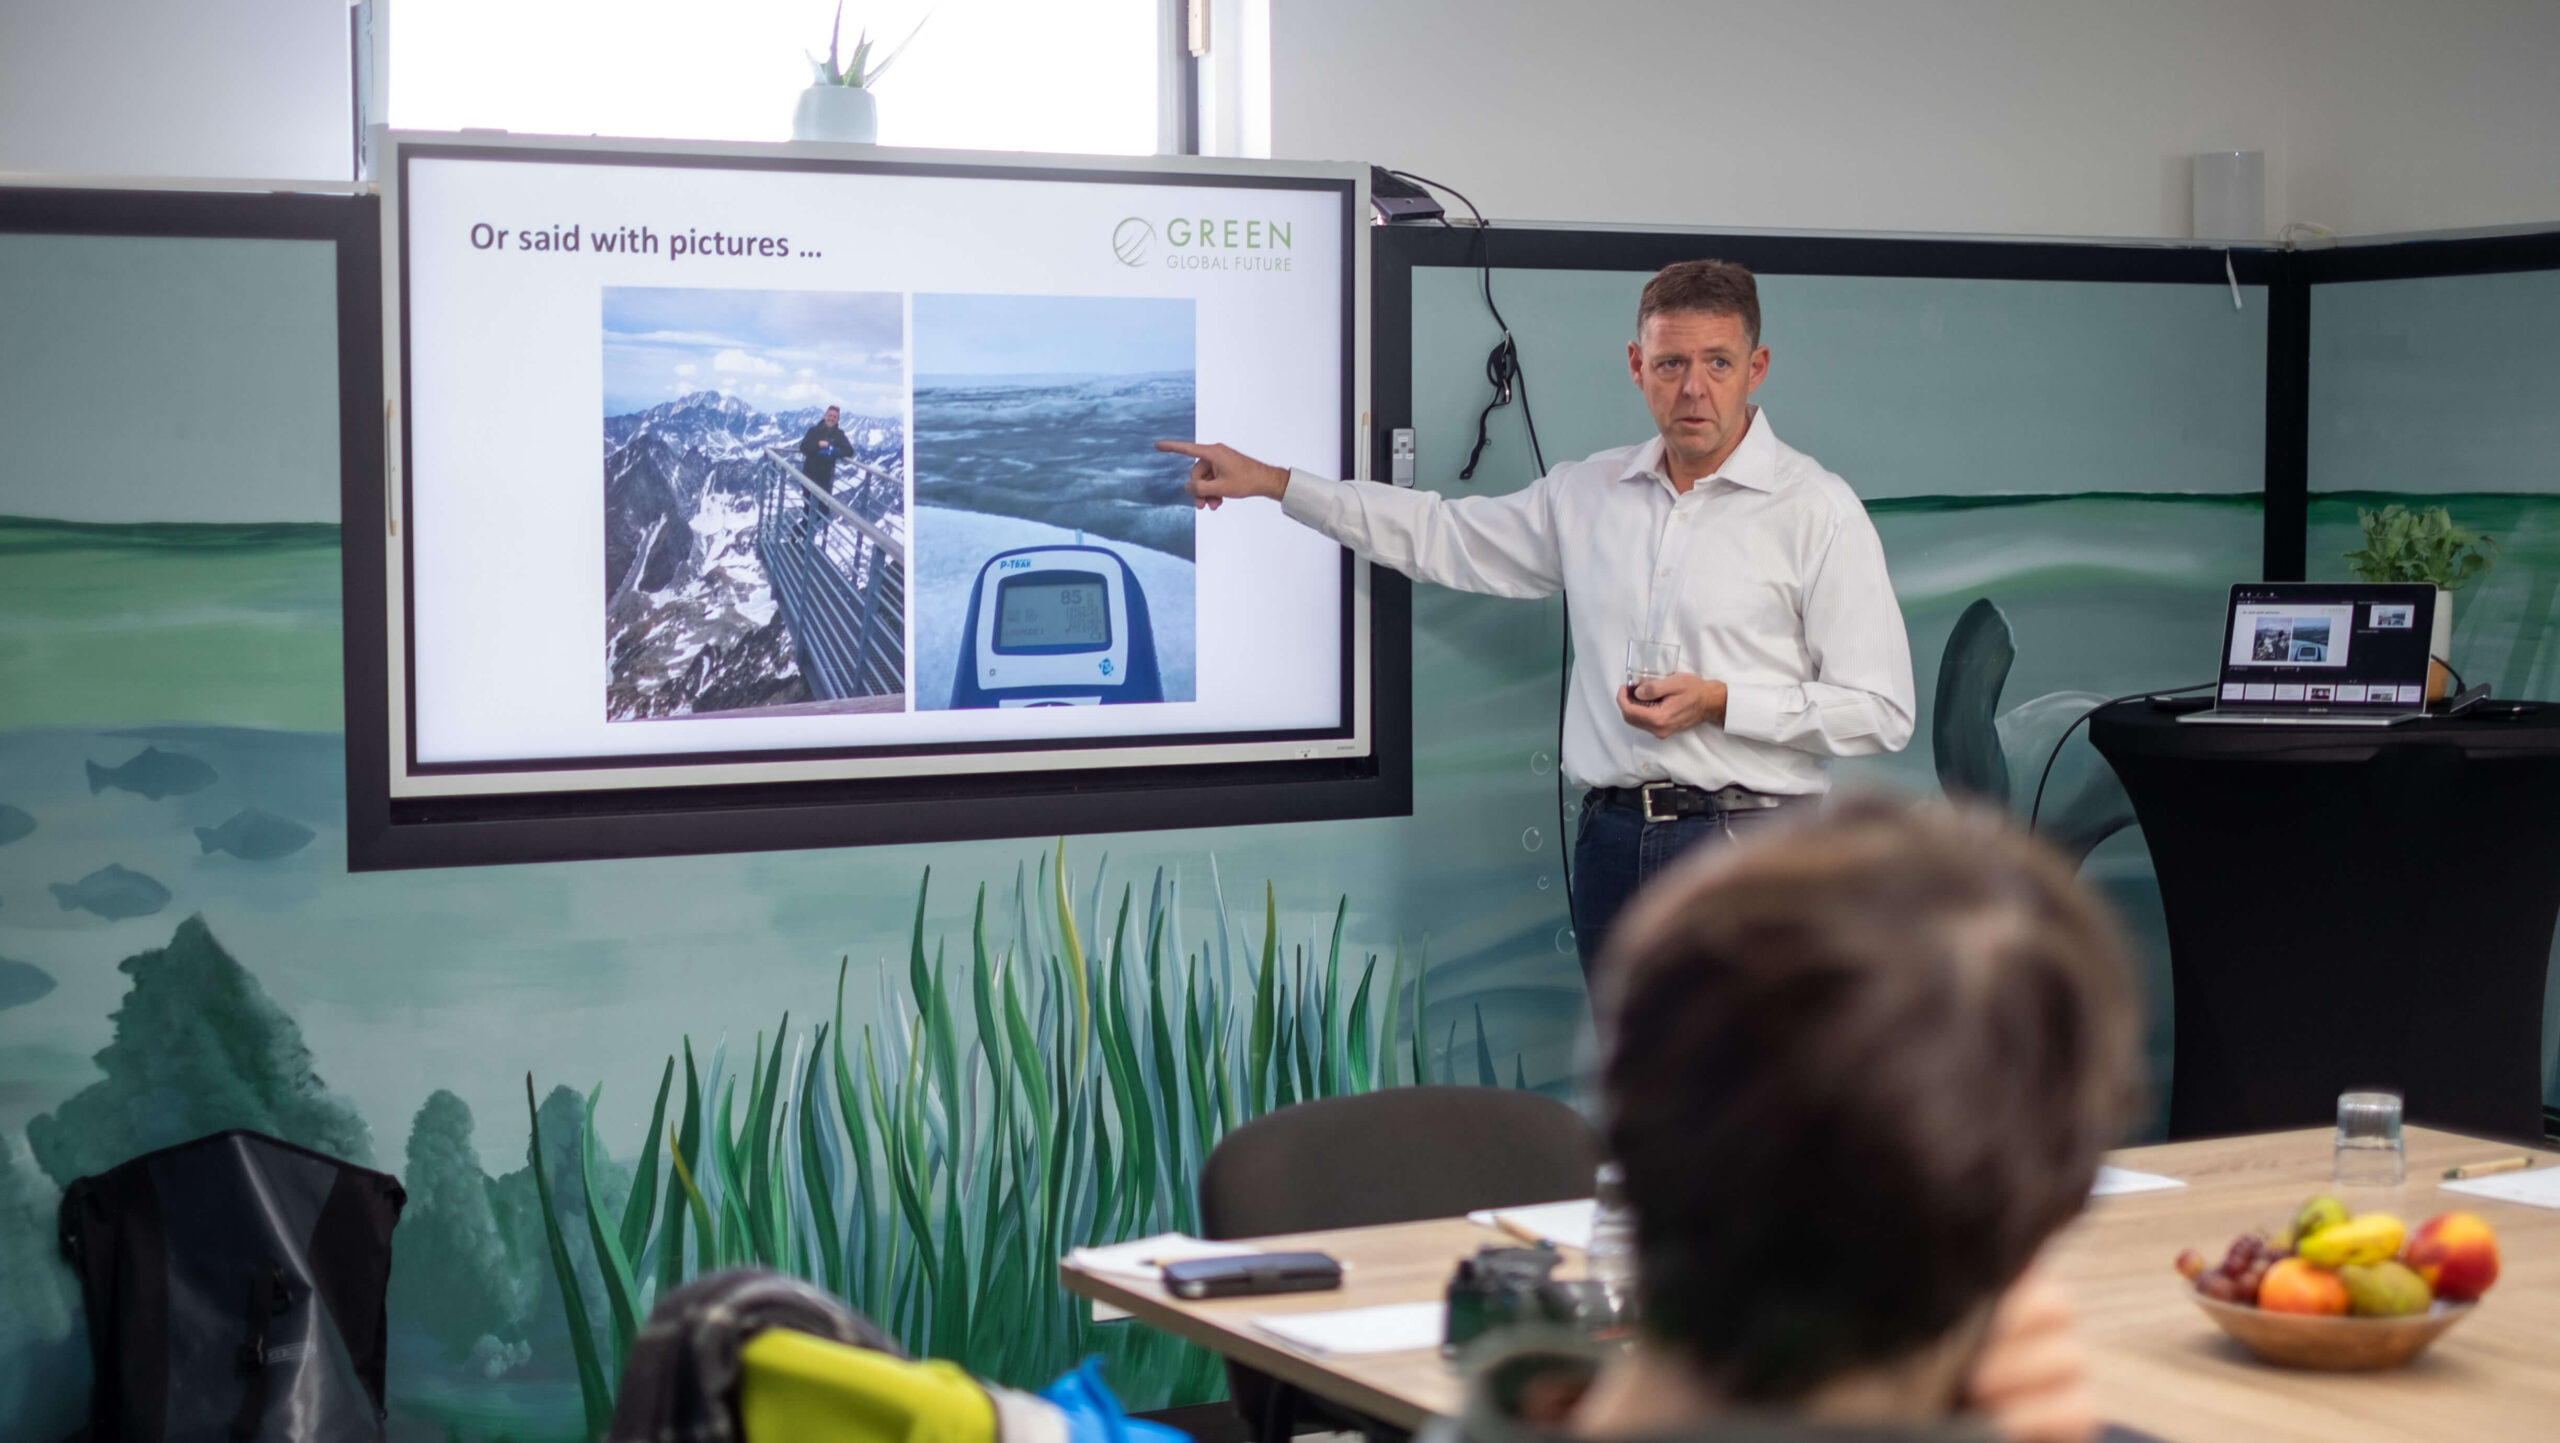
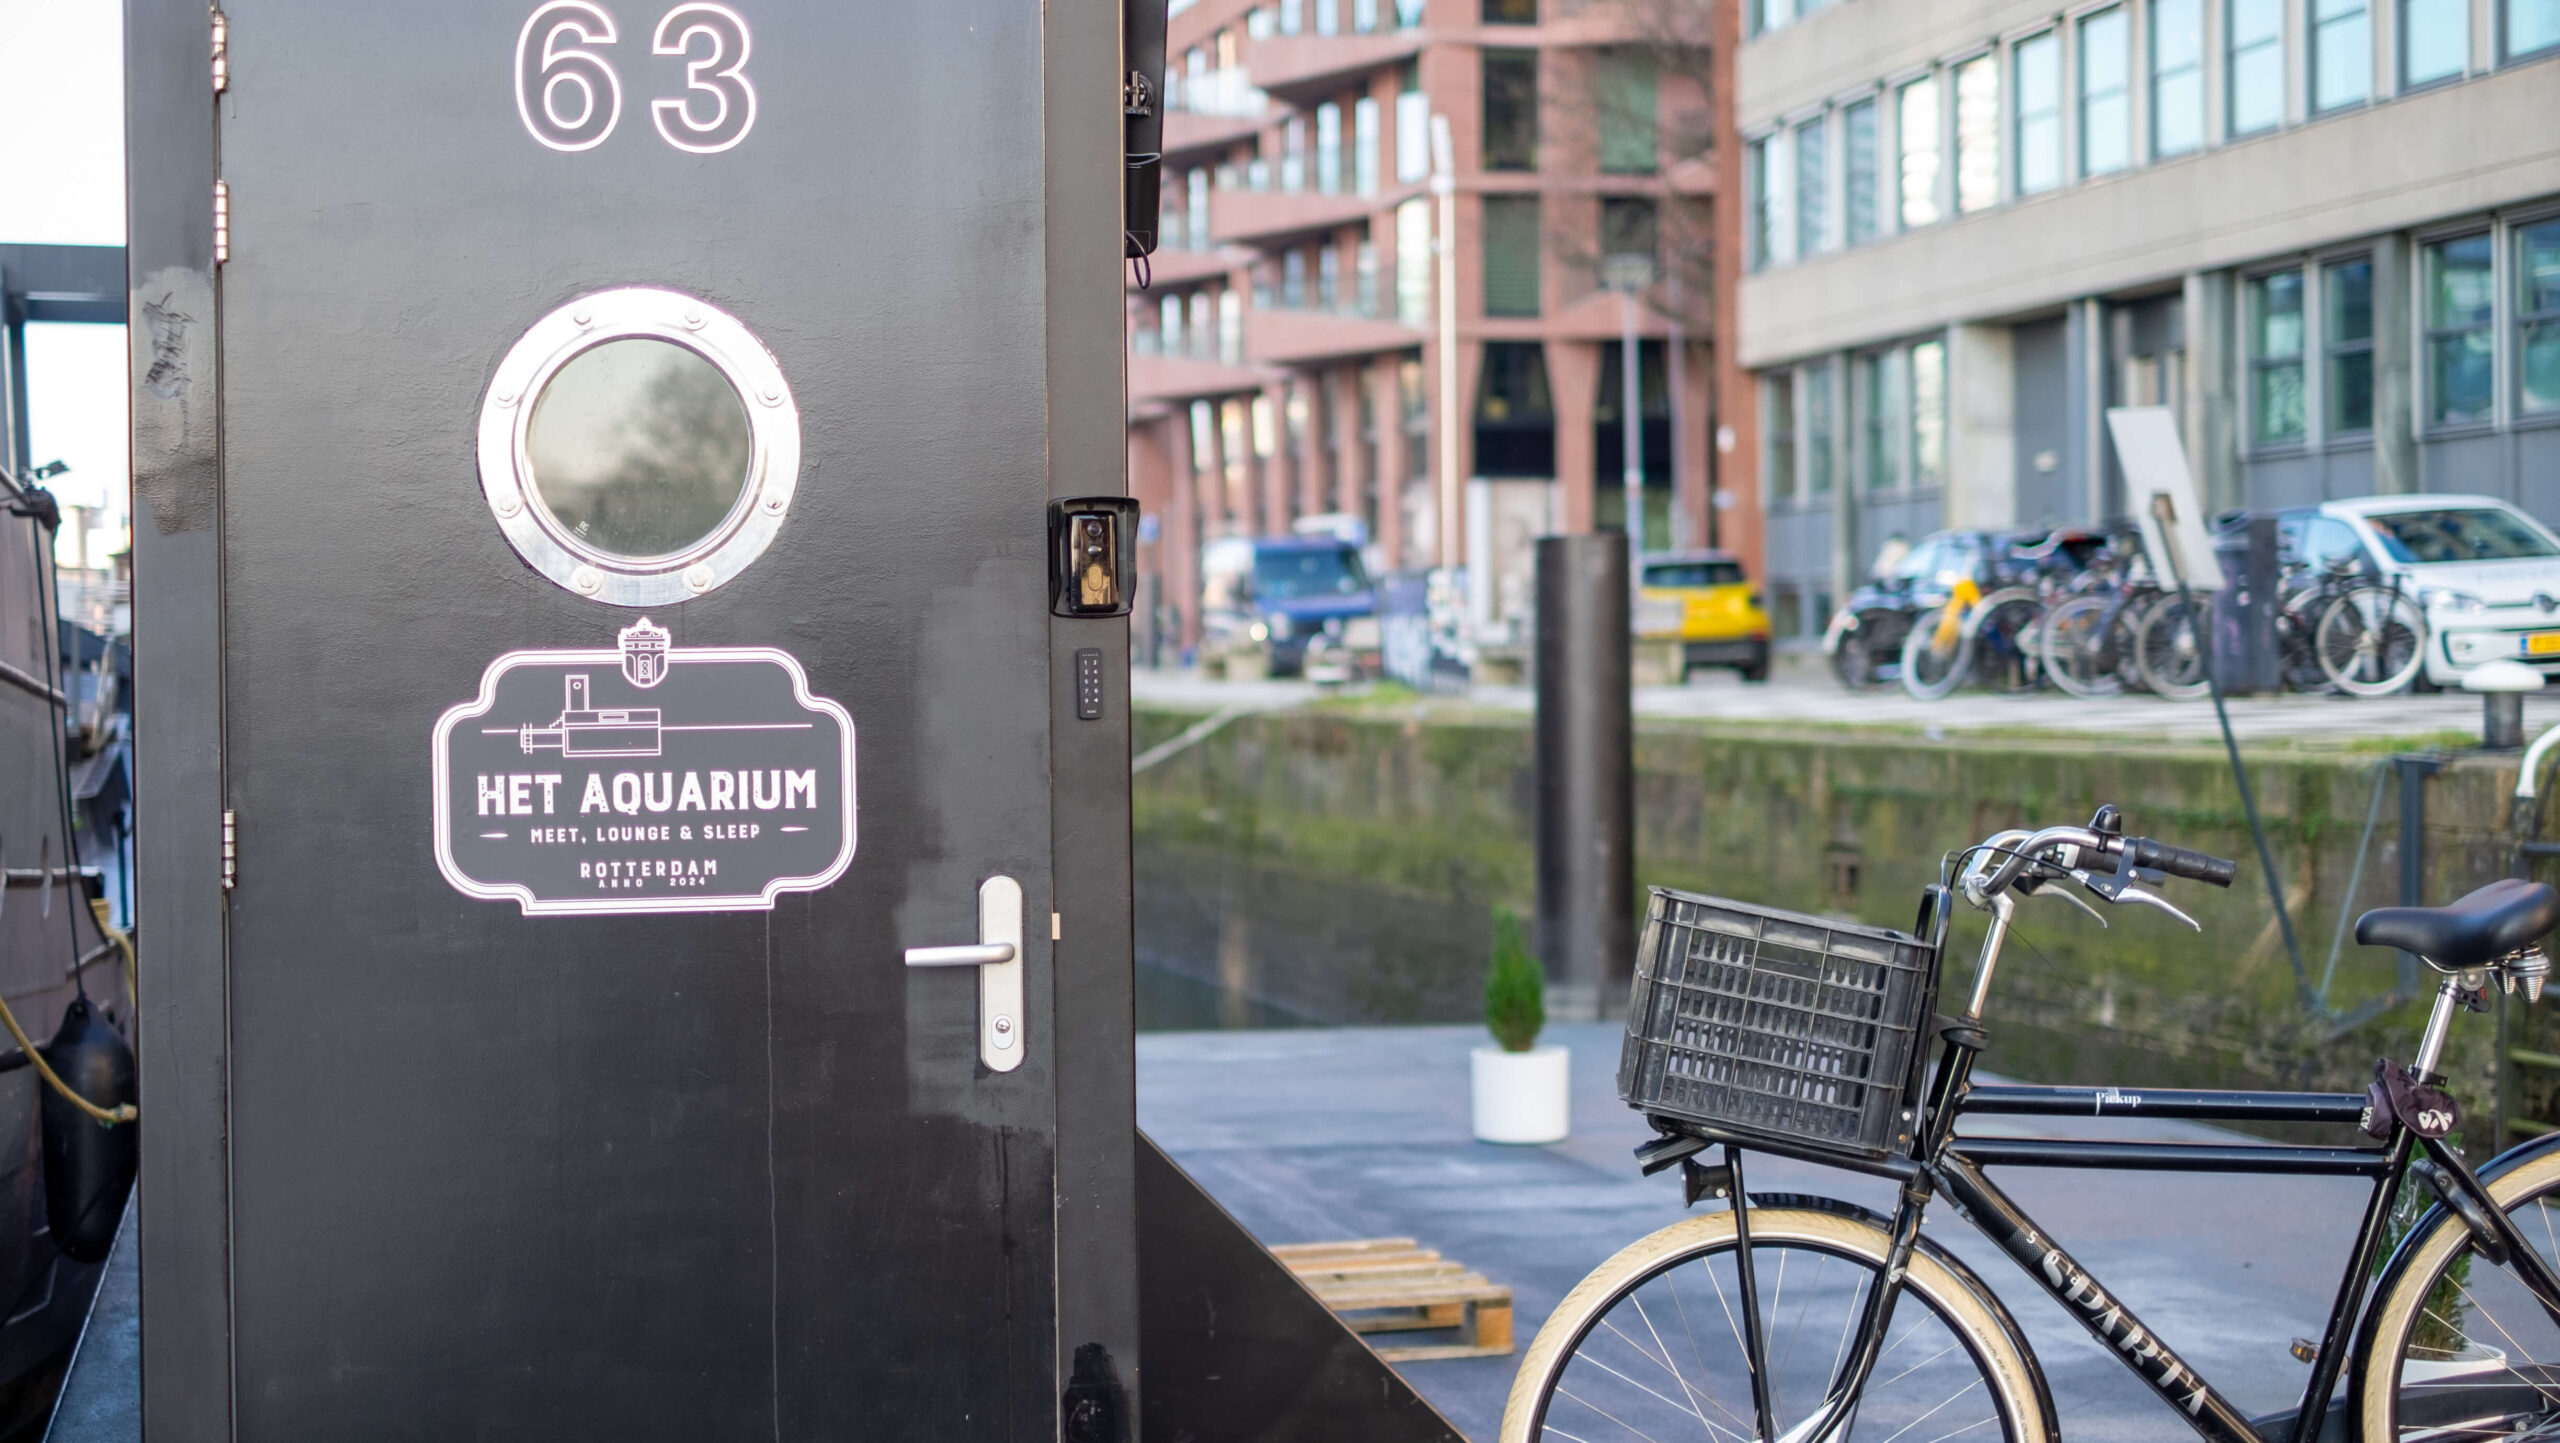
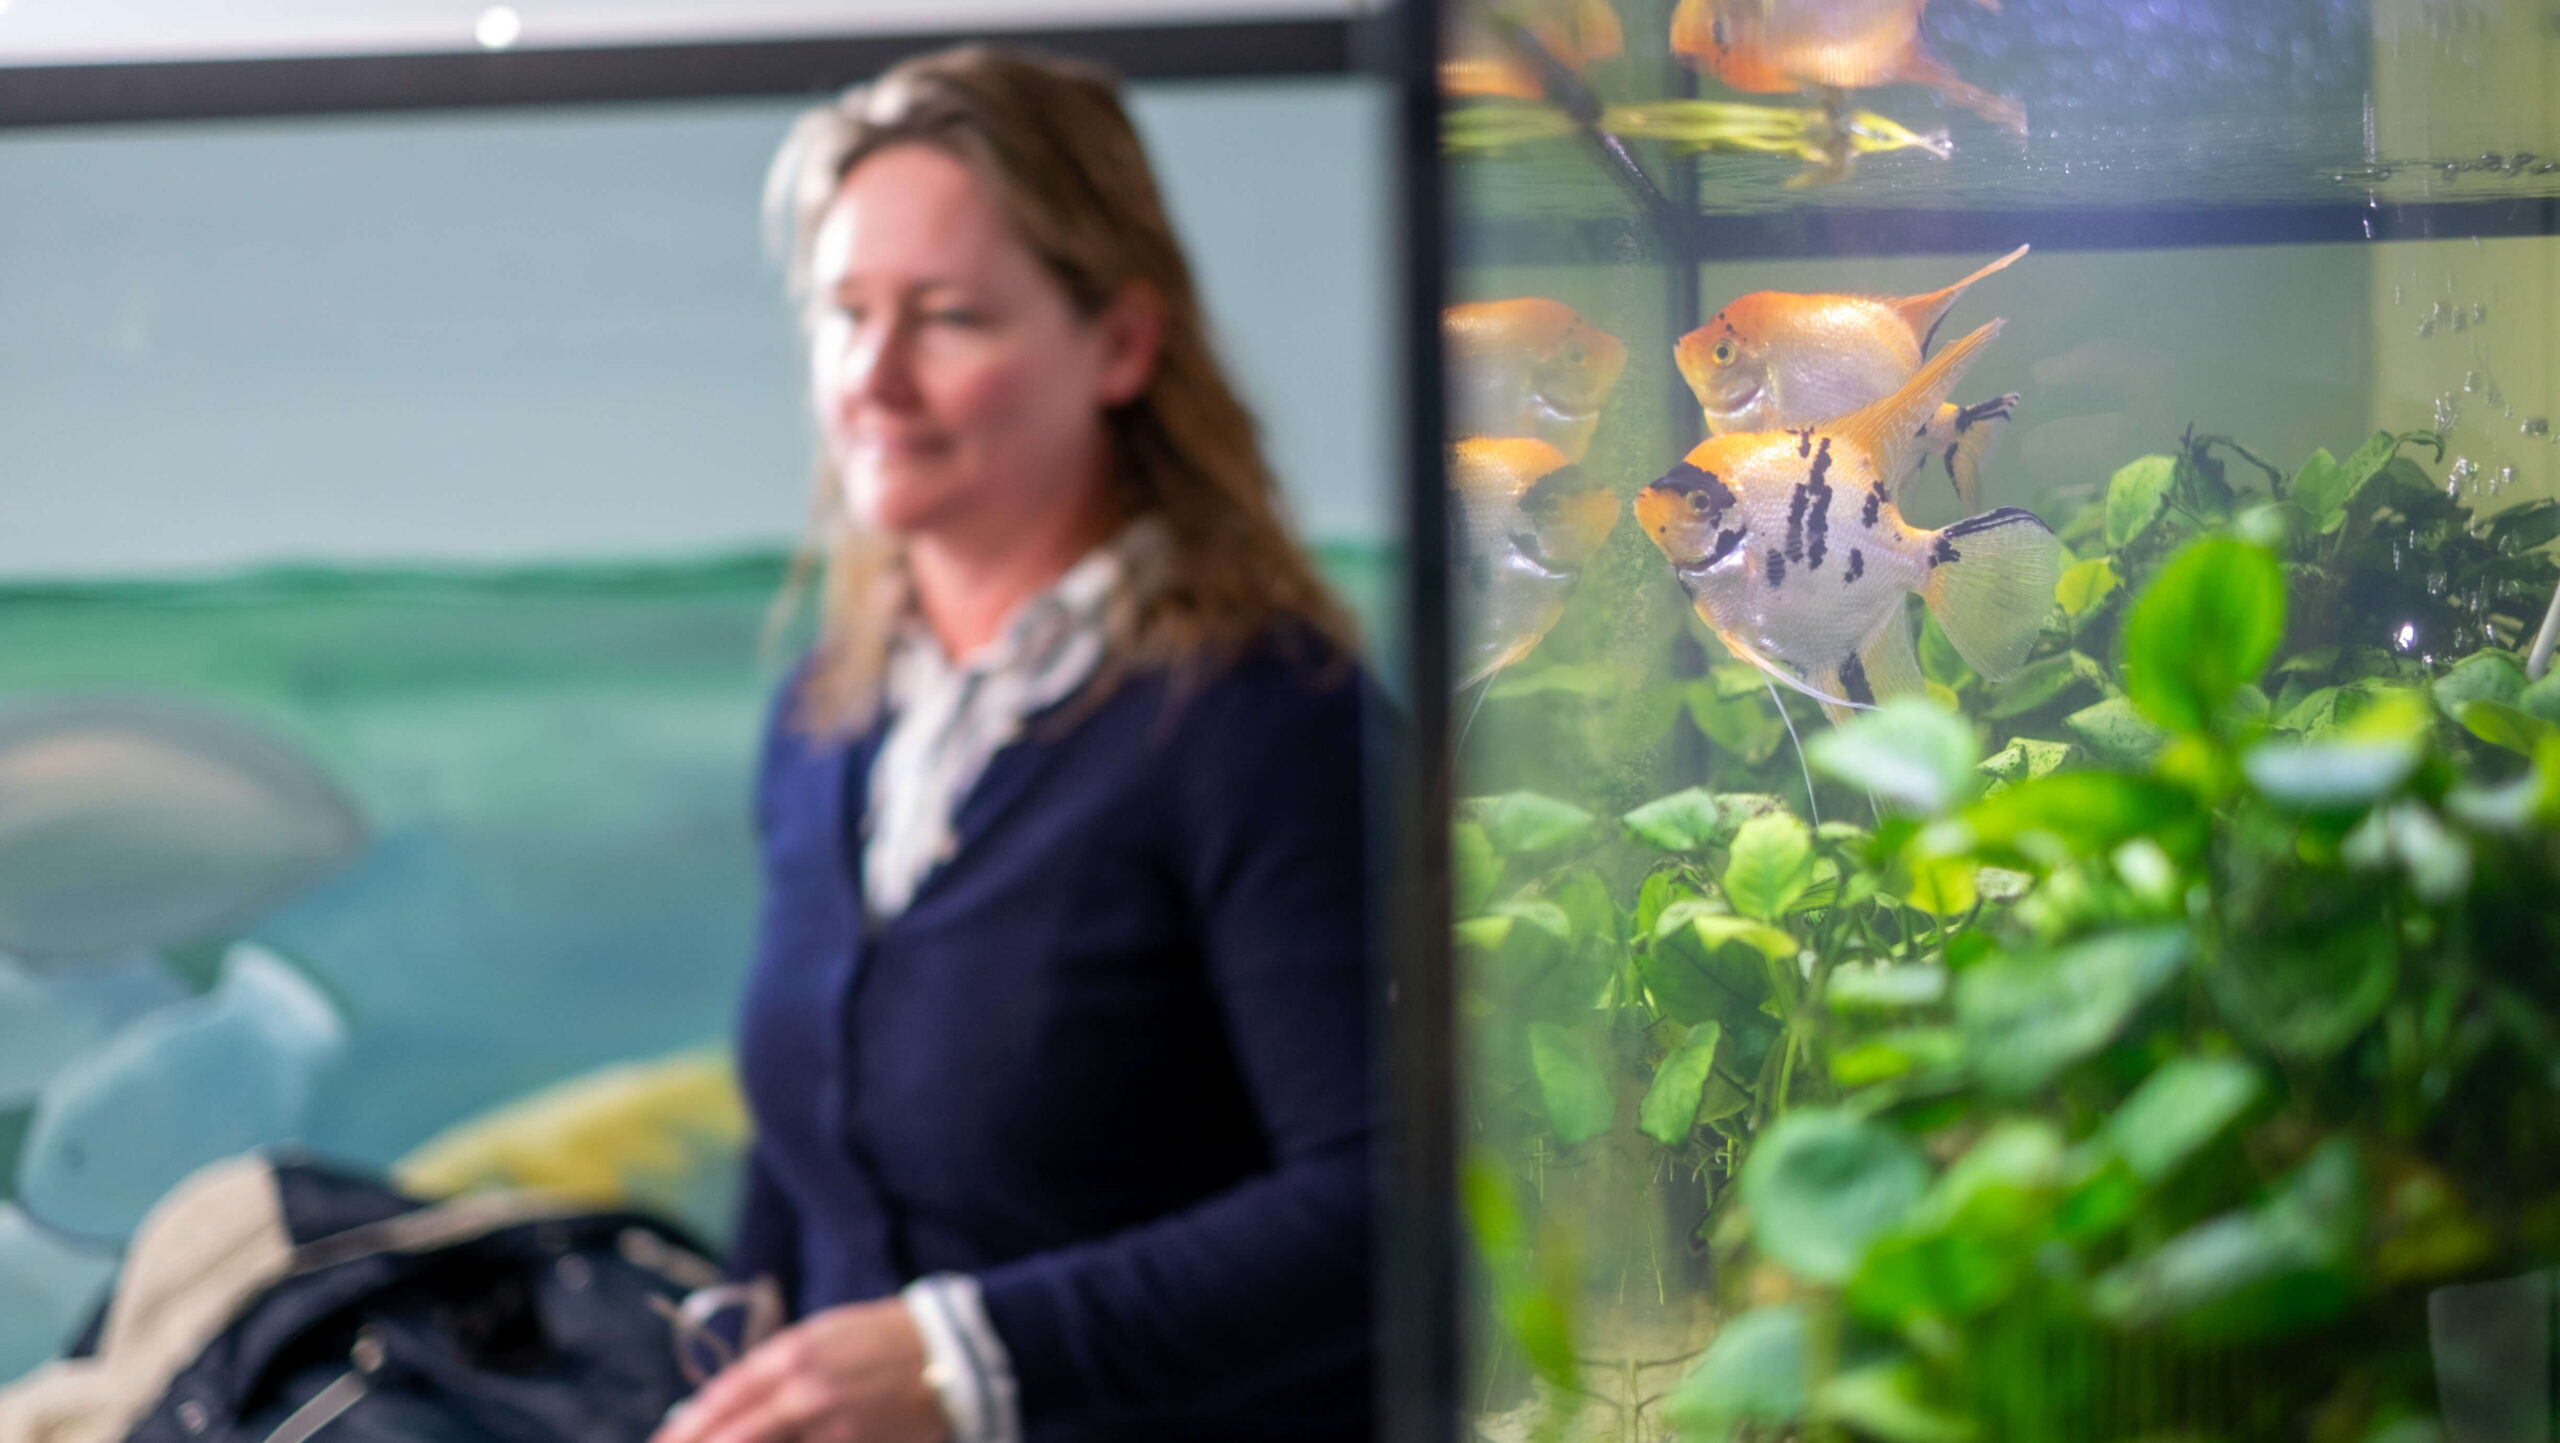
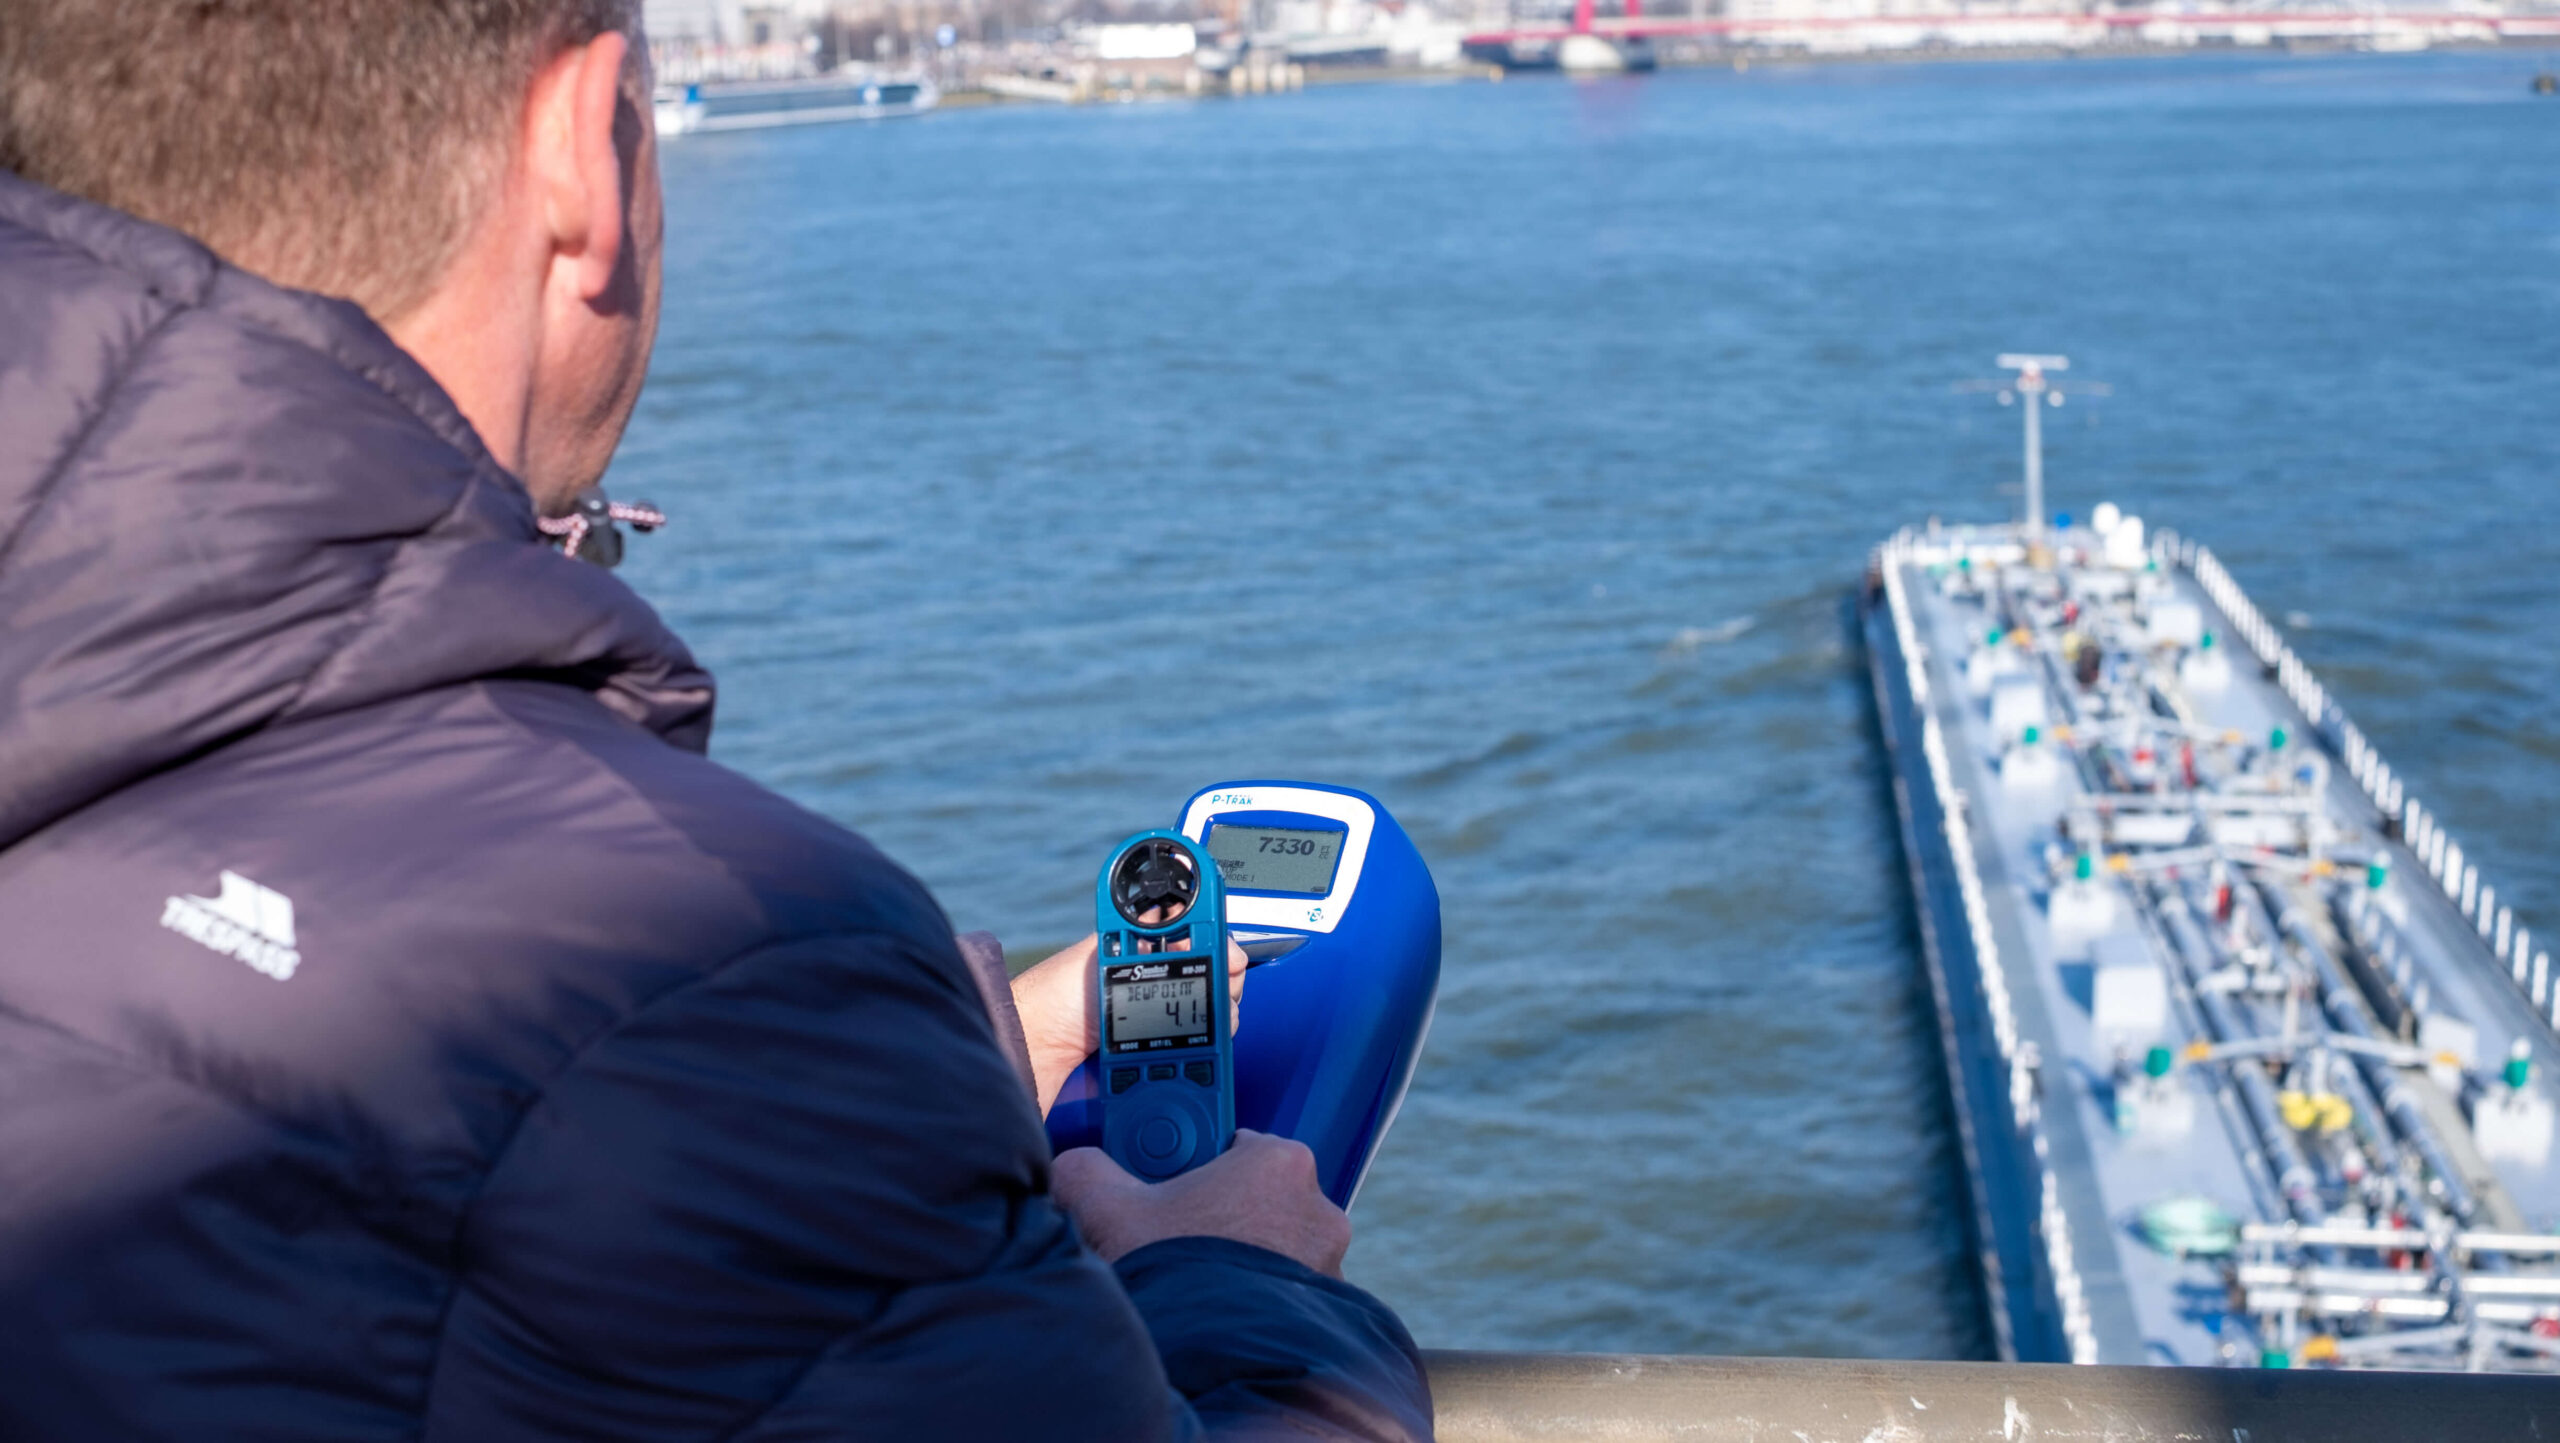
Nitrogen Dioxide (NO₂) Photo Gallery
A visual showcase of our ultrafine particles pollution monitoring activities, equipment, and community engagement efforts.
Volunteer Registration Form
Our citizen science program engages community members in the collection and analysis of pollution data. Through this collaborative approach, we’re able to gather more comprehensive data across a wider geographic area, while also raising awareness about local air quality issues.
Participants receive training on proper monitoring techniques, equipment use, and data collection protocols. The data they collect is integrated into our broader pollution mapping initiative, providing valuable insights into spatial and temporal patterns of air pollution in our community.
Nitrogen Dioxide (NO₂)
Overview Nitrogen Dioxide (NO₂) Air Pollution
Nitrogen dioxide (NO₂) is a harmful air pollutant produced primarily by vehicle emissions and industrial processes. It contributes to the formation of smog, acid rain, and can cause respiratory problems. Our monitoring program tracks NO2 levels across di!erent locations in the Port of Rotterdam area.
The project integrates our NO2 monitoring with historical data from existing Palmes tubes monitoring networks (luchmeetnet.nl), providing a valuable long-term background data set for comprehensive analysis.
Key NO₂ Emission Sources in the Port of Rotterdam
1. Industrial combustion: Refineries, power plants, and chemical factories emit NOx through high stacks
3. Port logistics: Diesel-powered equipment like terminal tractors and container handlers
4. Seagoing vessels: Contribute to local NO2, especially when docked and running auxiliary engines
Unlike UFPs, NO₂ is more widespread and persistent in the environment, which is why we employ a different monitoring approach using diffusion tubes that sample over longer time periods (2 weeks).
Methodology Nitrogen Dioxide (NO₂)
1. Equipment Selection
We use Palmes-type diffusion tubes for passive sampling of NO₂. These simple, cost-effective devices allow us to deploy samplers at all 12 monitoring sites simultaneously.
2. Sampling Frequency
Diffusion tubes are replaced every 2 weeks, providing time-averaged NO₂ concentration data that captures longer-term exposure patterns.
3. Quality Control
We include one blank tube per batch and duplicate tubes at 10% of sites to ensure data quality and identify any potential sampling or analysis issues.
4. Laboratory Analysis
After the two-week exposure period, tubes are collected and sent to a certified laboratory for analysis of NO₂ concentration using standard analytical methods.
5. Cross-Validation
We cross-validate our NO₂ measurements with data from offcial LML stations (6 of our 12 sites are co-located with LML stations) to ensure accuracy and calibrate our results.
6. Vessel Activity Correlation
NO₂ data is analyzed alongside the vessel tracking information to identify potential relationships between shipping activity and nitrogen dioxide levels in port-adjacent areas.
Results Nitrogen Dioxide (NO₂)
Our NO₂ monitoring program is generating valuable data about nitrogen dioxide concentrations and patterns in the Port of Rotterdam area. As this is an ongoing project, results will be updated as new data becomes available.
Initial results will be interpreted and explained in this section as we capture and process the data.
Data Nitrogen Dioxide (NO₂)
Access our raw nitrogen dioxide (NO₂) measurement data from the Port of Rotterdam monitoring project. Following Agile development principles, we provide direct access to our Google Drive repository where all NO₂ monitoring data is systematically organized by date.
How Our NO₂ Data Is Organized
All data is stored in a structured folder system:
Root folder: NO₂ Data
Year-Month folders: Named in YYYY.MM format (e.g., 2025.01 for January 2025)
CSV files: Named according to the date range and site number (e.g., 20250501-20250514_site01 for the first two weeks of May 2025 at site 1)
Each CSV file contains:
Date range information for the two-week monitoring period
Site-specific data including precise location coordinates and site characteristics
NO₂ concentration values measured using passive diffusion tubes
Quality control indicators including blank and duplicate measurements
Meteorological conditions averaged over the monitoring period
With 12 monitoring sites and bi-weekly sampling, each month contains 24 data files representing the complete spatial and temporal coverage of our NO₂ monitoring network. This approach to data sharing follows our Agile SCRUM development principles, providing transparent access to the raw monitoring data as we iteratively develop more sophisticated data visualization and analysis tools.
You can download individual CSV files or entire year-month folders from Google Drive to work with the data locally. For best results:
Each file represents a complete two-week sampling period (e.g., May 1-14, 2025) for a specific monitoring site
Use spreadsheet software like Excel or Google Sheets for basic analysis and visualization
For temporal trend analysis, combine multiple date ranges from the same site using R or Python
For spatial analysis, combine data from all 12 sites for the same time period and import into GIS software
Compare our data with EU regulatory limits (40 µg/m³) and WHO guidelines (10 µg/m³) to assess air quality status
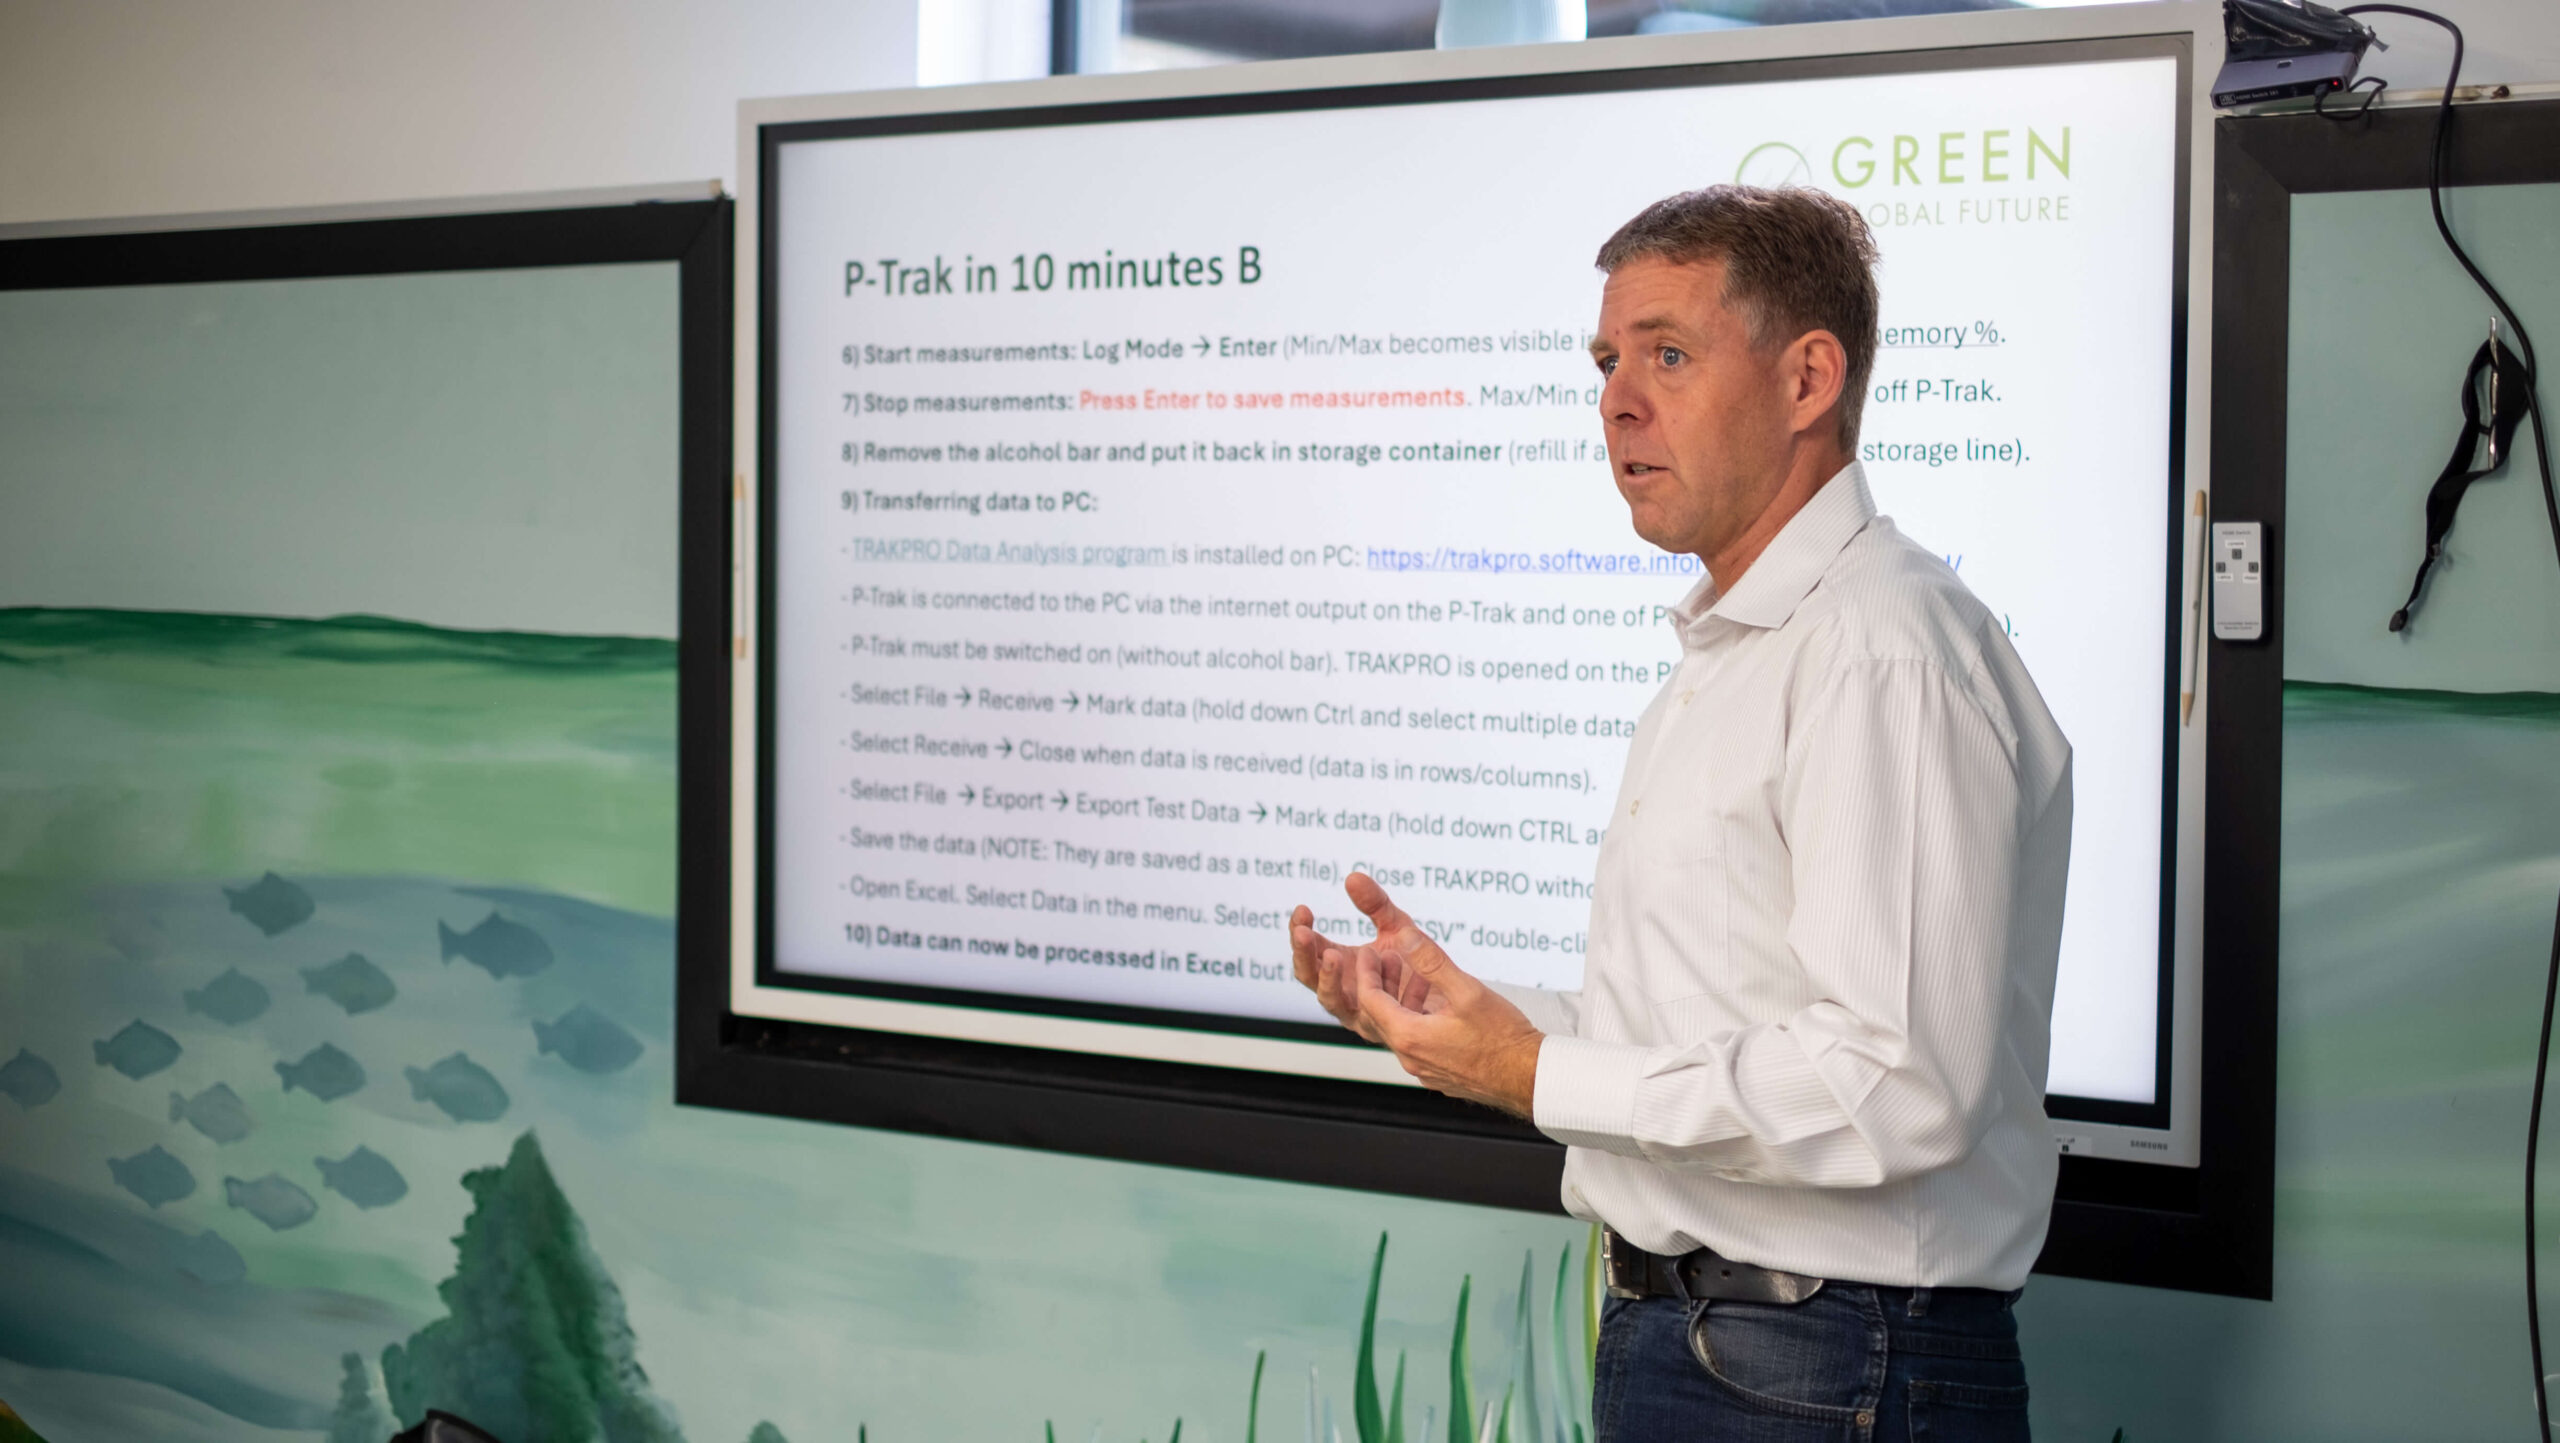
Training Materials UFP
Access our comprehensive training resources for monitoring ultrafine particles in the Port of Rotterdam area. These materials are designed for citizen scientists, students, and anyone interested in air quality monitoring.
Training Materials UFP
Access our comprehensive video training resources for monitoring ultrafine particles in the Port of Rotterdam area. This collection covers essential knowledge and techniques for citizen scientists participating in our monitoring program.
Playlist
11 Videos
Training Documents
Download and reference these training documents for our ultrafine particle monitoring program. These materials include instructional guides, reference sheets, and visual aids.
What is NO₂ and where does it come from in the port area?
Nitrogen dioxide (NO₂) is a reddish-brown gas with a sharp, harsh odor. In the Port of Rotterdam area, it comes primarily from diesel engines (ships, trucks, port machinery), industrial combustion processes (refineries, power plants), and other fossil fuel burning. Ship auxiliary engines used while vessels are docked, as well as main engines during arrival and departure, are significant contributors to NO₂ pollution in port-adjacent areas.
How does NO₂ affect health?
Exposure to NO₂ can irritate the respiratory system and exacerbate respiratory diseases, particularly asthma. Short-term exposure to high concentrations can cause inflammation of the airways, while long-term exposure may contribute to the development of respiratory conditions and reduced lung function. Children, the elderly, and people with pre-existing respiratory conditions are especially vulnerable to the health effects of NO₂. In port communities, the combination of NO₂ with other pollutants may compound these health effects.
How is NO₂ monitored in this project?
Our project uses Palmes-type diffusion tubes for NO₂ monitoring. These simple, cost-effective devices are deployed at all 12 monitoring sites and replaced every two weeks. The tubes passively collect NO₂ from the air, providing time-averaged concentration data. After the exposure period, the tubes are sent to a certified laboratory for analysis. This approach allows us to build a comprehensive picture of NO₂ distribution across the port area and track changes over time.
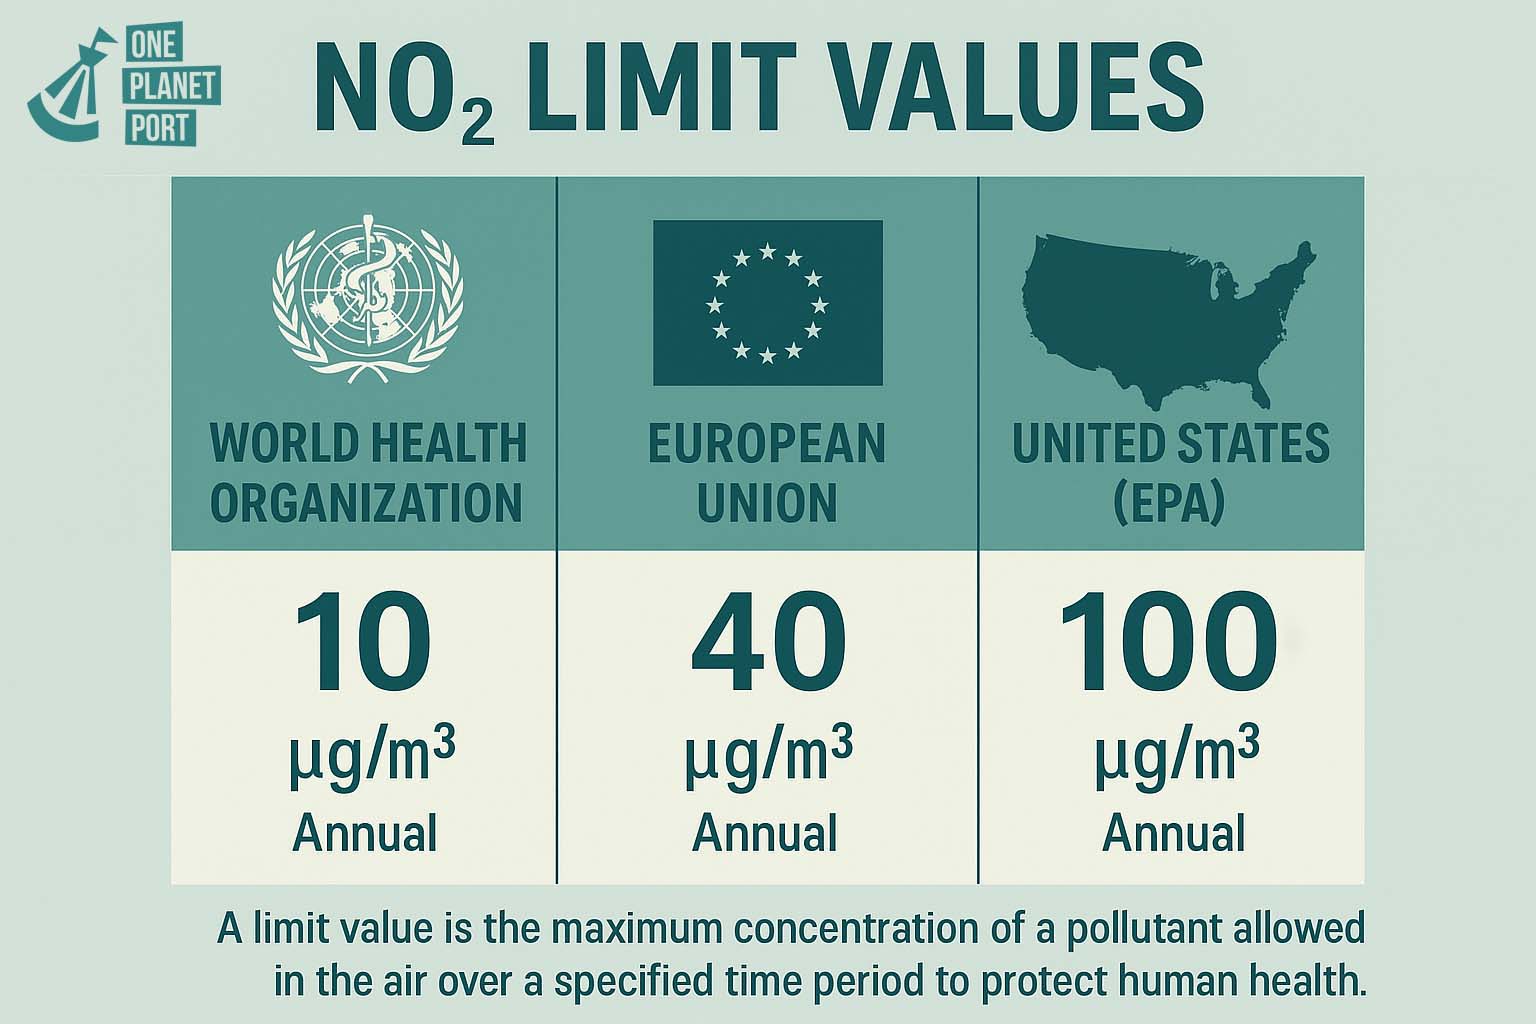
What are the regulatory standards for NO₂?
In the European Union, the regulatory limit for NO₂ is an annual mean of 40 µg/m³. The World Health Organization (WHO) has a more stringent guideline of 10 µg/m³ annual mean, reflecting the latest health evidence. Our monitoring project compares measured concentrations to both the EU regulatory limit and the WHO guideline to provide context for the potential health implications of observed NO₂ levels in the Port of Rotterdam area.
Training External Resources
Explore these trusted external resources for additional information about ultrafine particle monitoring, pollution research, and community science initiatives.